“Augusto has shared some cutting edge information in our forums, including his process for planning, structuring, and marketing internationally focused multi-lingual content. Anytime someone has questions about anything to do with Spanish Augusto is the first person I send them to.”
Aaron Wall
SEOBook.com

Worldwide Spanish Speaking Population Statistics
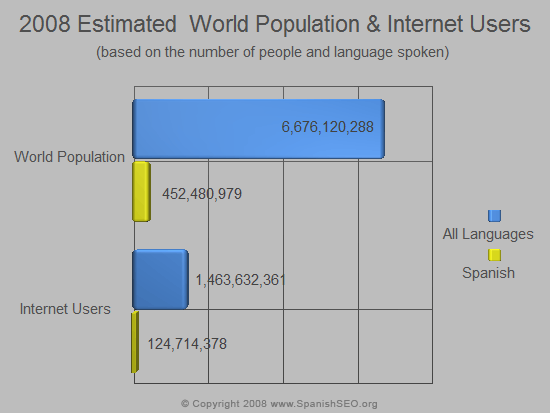
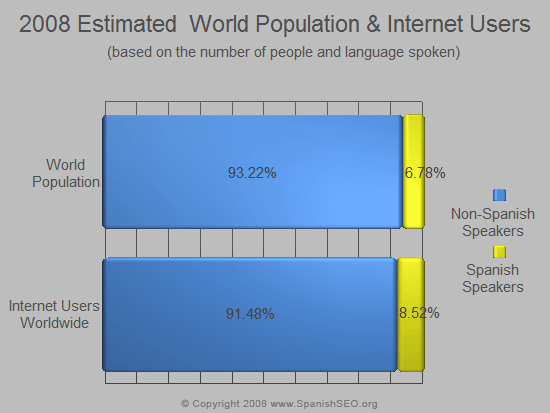
2008 Estimated World Population & Internet Users(based on the number of people and language spoken) |
|||||
|---|---|---|---|---|---|
|
Language |
2008 Estimated |
Percentage of |
2008 World Internet Users |
Percentage of Internet Users Worldwide |
|
| All Languages | 6,676,120,288 | 100.00 % | 1,463,632,361 | 100.00 % | |
| Spanish | 452,480,979 | 6.78 % | 124,714,378 | 8.52 % | |
 |
|||||
 |
|||||
| Sources: (1) (2) (3) | |||||
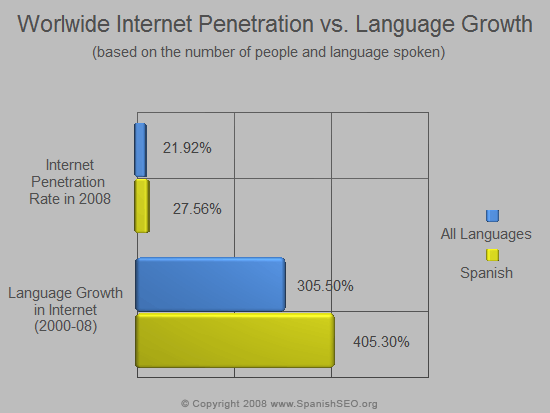
Worldwide Internet Penetration & Language Growth(based on the number of people and language spoken) |
|||||
|---|---|---|---|---|---|
|
Language |
2008 Estimated |
World Internet Users |
Internet |
Language Growth |
|
| All Languages | 6,676,120,288 | 1,463,632,361 | 21.92 % | 305.5 % | |
| Spanish | 452,480,979 | 124,714,378 | 27.56 % | 405.3 % | |
 |
|||||
| Sources: (1) (2) (3) | |||||
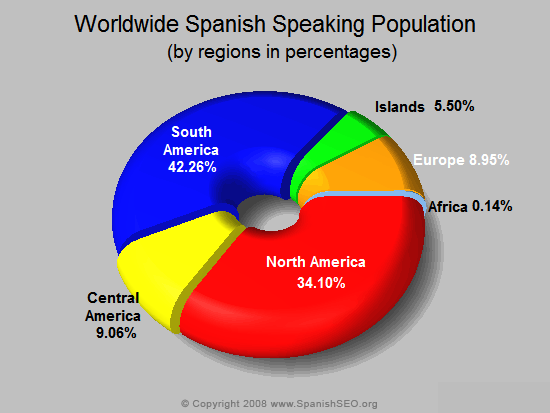
Worldwide Spanish Speaking Population(by regions and countries) |
|||||
|---|---|---|---|---|---|
|
Population (Number of People) |
Percentage of the Total Spanish Speaking Population |
Total Countries |
|||
Total Spanish Speaking Population |
452,480,979 | 100.00 % | 22 | ||
Spanish Speaking Population by Region |
|||||
|
Region |
Population |
Percentaje of the Total Spanish Speaking Population |
|||
| North America | 154,276,438 | 34.10 % | |||
| Central America | 40,982,389 | 9.06 % | |||
| South America | 191,225,429 | 42.26 % | |||
| Islands | 24,889,213 | 5.50 % | |||
| Europe | 40,491,051 | 8.95 % | |||
| Africa | 616,459 | 0.14 % | |||
| Total Worldwide | 452,480,979 | 100.00 % | |||
 |
|||||
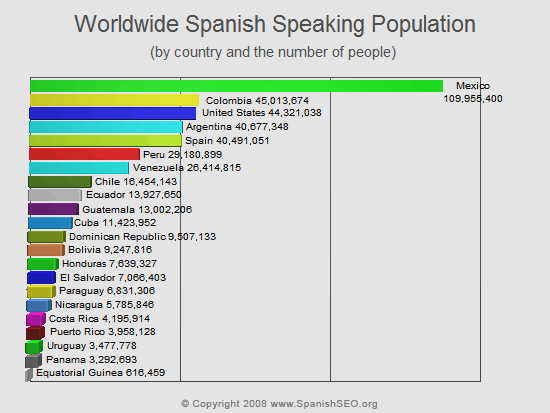
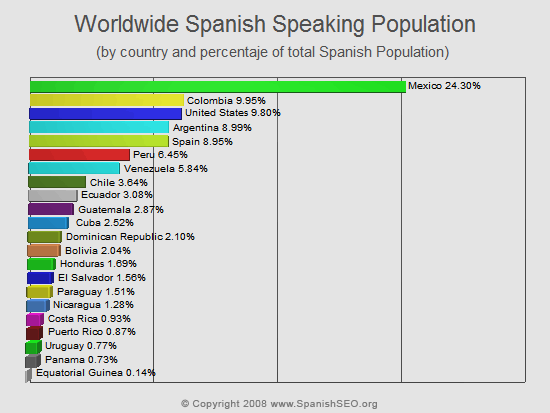
Spanish Speaking Population by Country |
|||||
|
Country |
Population |
Percentaje of the Total Spanish Speaking Population |
|||
| 1. Mexico | 109,955,400 | 24.30 % | |||
| 2. Colombia | 45,013,674 | 9.95 % | |||
| 3. United States | 44,321,038 | 9.80 % | |||
| 4. Argentina | 40,677,348 | 8.99 % | |||
| 5. Spain | 40,491,051 | 8.95 % | |||
| 6. Perú | 29,180,899 | 6.45 % | |||
| 7. Venezuela | 26,414,815 | 5.84 % | |||
| 8. Chile | 16,454,143 | 3.64 % | |||
| 9. Ecuador | 13,927,650 | 3.08 % | |||
| 10. Guatemala | 13,002,206 | 2.87 % | |||
| 11. Cuba | 11,423,952 | 2.52 % | |||
| 12. Dominican Republic | 9,507,133 | 2.10 % | |||
| 13. Bolivia | 9,247,816 | 2.04 % | |||
| 14. Honduras | 7,639,327 | 1.69 % | |||
| 15. El Salvador | 7,066,403 | 1.56 % | |||
| 16. Paraguay | 6,831,306 | 1.51 % | |||
| 17. Nicaragua | 5,785,846 | 1.28 % | |||
| 18. Costa Rica | 4,195,914 | 0.93 % | |||
| 19. Puerto Rico | 3,958,128 | 0.87 % | |||
| 20. Uruguay | 3,477,778 | 0.77 % | |||
| 21. Panama | 3,292,693 | 0.73 % | |||
| 22. Equatorial Guinea | 616,459 | 0.14 % | |||
| Total Worldwide | 452,480,979 | 100.00 % | |||
 |
|||||
 |
|||||
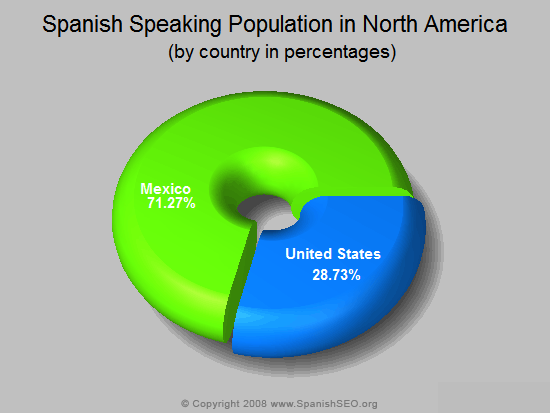
Spanish Speaking Population in North America |
|||||
|
Country or Area |
Capital City |
Spanish Speaking Population (Number of People) |
Percentaje of the Total Spanish Speaking Population |
Percentaje of the Regional Spanish Speaking Population |
World Rank |
| United States | Washington D.C | 44,321,038 | 9.80 % | 28.73% | 3 |
| Mexico | Mexico City | 109,955,400 | 24.30% | 71.27% | 11 |
| Total North America | 154,276,438 | 34.10% | 100.00% | ||
 |
|||||
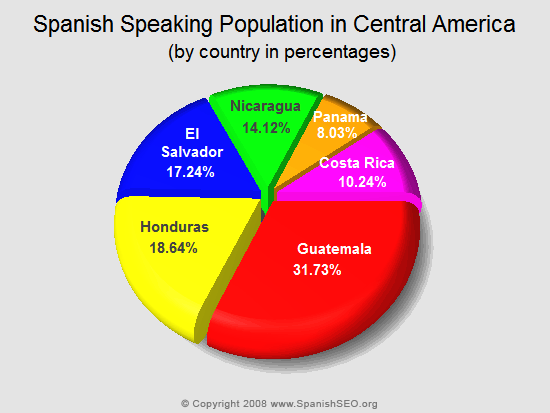
Spanish Speaking Population in Central America |
|||||
|
Country or Area |
Capital City |
Spanish Speaking Population (Number of People) |
Percentaje of the Total Spanish Speaking Population |
Percentaje of the Regional Spanish Speaking Population |
World Rank |
| Guatemala | Guatemala City | 13,002,206 | 2.87 % | 31.73 % | 67 |
| Honduras |
Tegucigalpa | 7,639,327 | 1.69 % | 18.64 % | 94 |
| El Salvador | San Salvador | 7,066,403 | 1.56 % | 17.24 % | 99 |
| Nicaragua | Managua | 5,785,846 | 1.28 % | 14.12 % | 108 |
| Panama | Panama City | 3,292,693 | 0.73 % | 8.03 % | 135 |
| Costa Rica | San José | 4,195,914 | 0.93 % | 10.24 % | 123 |
| Total Central America | 40,982,389 | 9.06 % | 100.00 % | ||
 |
|||||
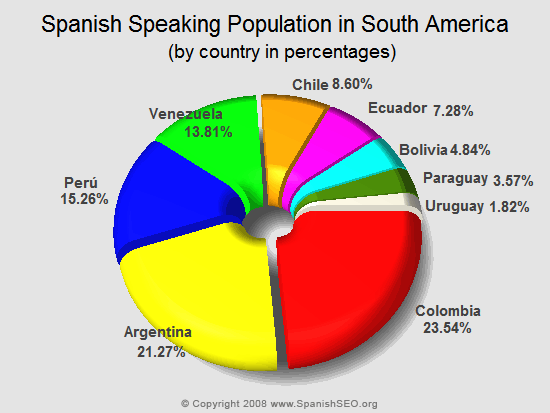
Spanish Speaking Population in South America |
|||||
|
Country or Area |
Capital City |
Spanish Speaking Population (Number of People) |
Percentaje of the Total Spanish Speaking Population |
Percentaje of the Regional Spanish Speaking Population |
World Rank |
| Colombia | Bogotá | 45,013,674 | 9.95 % | 23.54 % | 27 |
| Argentina | Buenos Aires | 40,677,348 | 8.99 % | 21.27 % | 29 |
| Perú | Lima | 29,180,899 | 6.45 % | 15.26 % | 41 |
| Venezuela | Caracas | 26,414,815 | 5.84 % | 13.81 % | 45 |
| Chile | Santiago | 16,454,143 | 3.64 % | 8.60 % | 60 |
| Ecuador | Quito | 13,927,650 | 3.08 % | 7.28 % | 65 |
| Bolivia | La Paz | 9,247,816 | 2.04 % | 4.84 % | 87 |
| Paraguay | Asunción | 6,831,306 | 1.51 % | 3.57 % | 101 |
| Uruguay | Montevideo | 3,477,778 | 0.77 % | 1.82 % | 131 |
| Total South America | 191,225,429 | 42.26 % | 100.00 % | ||
 |
|||||
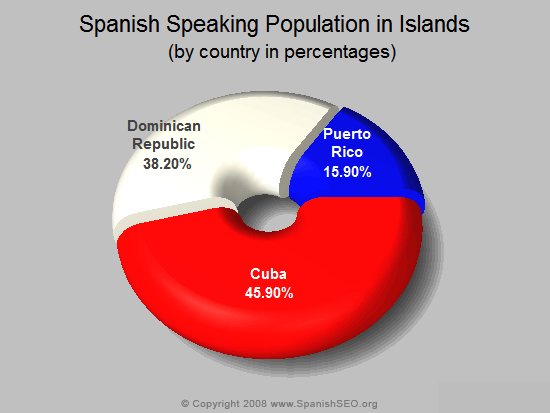
Spanish Speaking Population in Islands |
|||||
|
Country or Area |
Capital City |
Spanish Speaking Population (Number of People) |
Percentaje of the Total Spanish Speaking Population |
Percentaje of the Regional Spanish Speaking Population |
World Rank |
| Cuba | Havana | 11,423,952 | 2.52 % | 45.90 % | 73 |
| Dominican Republic | Santo Domingo | 9,507,133 | 2.10 % | 38.20 % | 86 |
| Puerto Rico | San Juan | 3,958,128 | 0.87 % | 15.90 % | 127 |
| Total Islands | 24,889,213 | 5.50 % | 100.00 % | ||
 |
|||||
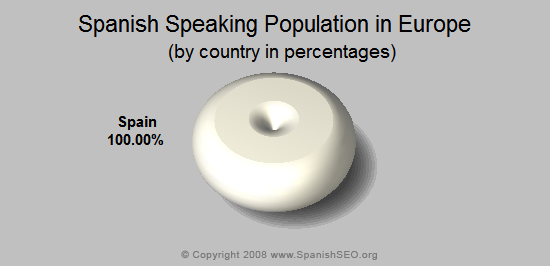
Spanish Speaking Population in Europe |
|||||
|
Country or Area |
Capital City |
Spanish Speaking Population (Number of People) |
Percentaje of the Total Spanish Speaking Population |
Percentaje of the Regional Spanish Speaking Population |
World Rank |
| Spain | Madrid | 40,491,051 | 8.95 % | 8.95 % | 30 |
| Total Europe | 40,491,051 | 8.95 % | 100.00 % | ||
 |
|||||
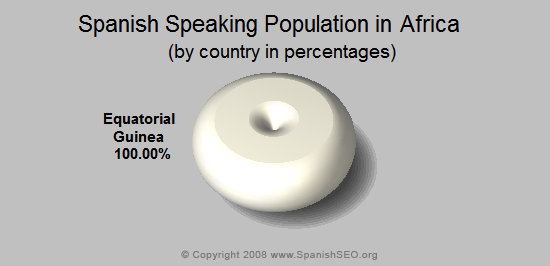
Spanish Speaking Population in Africa |
|||||
|
Country or Area |
Capital City |
Spanish Speaking Population (Number of People) |
Percentaje of the Total Spanish Speaking Population |
Percentaje of the Regional Spanish Speaking Population |
World Rank |
| Equatorial Guinea | Malabo | 616,459 | 0.14 % | 0.14 % | 164 |
| Total Africa | 616,459 | 0.14 % | 100.00 % | ||
 |
|||||
| Sources: (1) (2) | |||||
Bibliography, References and Sources
- (1) U.S. Census Bureau. International Data Base. Data updated 3-27-2008 (Release notes).
- (2) Population Division, U.S. Census Bureau. Annual Estimates of the Population by Sex, Race, and Hispanic or Latino Origin for the United States: April 1, 2000 to July 1, 2006 (NC-EST2006-03) (not including Puerto Rico) Release Date: May 17, 2007.
- (3) Internet World Stats. Updated on June 30, 2008.
Copyright © 2008 SpanishSEO.org. All rights reserved worldwide. Statistical information contained in this article may be used only for academic and educational purposes if the source is properly stated with an active link to Spanish SEO.
If you would like to reprint, republish and/or distribute this information in part or in whole for any other purposes than the stated above, permission shall be requested to info(at)SpanishSEO.org at all times.